4 Pandemics – Watch the Second Wave.
While attention is focused on the overall scale of COVID-19, from many of the leading specialists at Imperial College, Hong Kong University, and Harvard University. If this is a pandemic, which looks more and more likely by the day. Where is this pandemic currently in the pandemic cycle? Is it early in the cycle? Halfway through the cycle? Or is it at the end of the cycle?
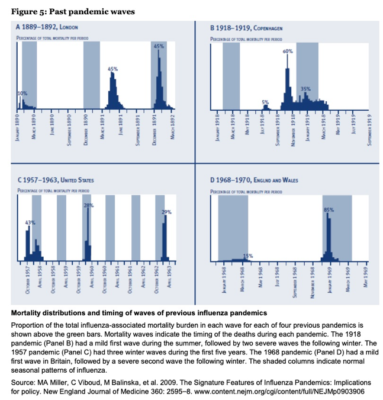
If we take the Ray Dalio principle, “Wherein history has this happened before?”. Many times, we have to go back in time where the current generation experiencing a difficult event wasn’t even alive when the past event occurred or was too young to be aware of it. What historical examples can we look at, to see what has happened during past pandemic waves? The Government of New Zealand in their pandemic preparation has put together an analysis of four major pandemics going back more than 130 years.

While the first wave gets everyone’s attention as a pandemic takes hold. Commonly there is a second and third wave that has been far more serious than the first wave. As the former FDA Chair, Dr. Scott Gottlieb said in a recent interview, “the next 2-4 weeks will be the most important to see what happens next”. If history repeats, it will be the second wave that is most concerning.
Will silver be a store of value for investors if COVID-19 escalates further?

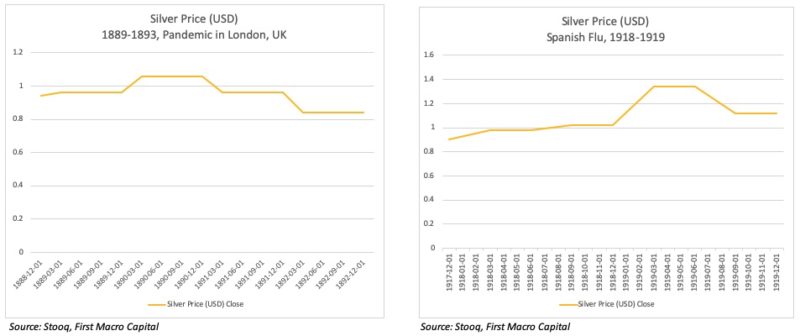
During the 1889-1892 pandemic, silver prices rose during the first phase of the pandemic to a high of $1.06/oz in 1890. As the pandemic got worse in 1891, the silver price then fell and continued to fall until the end of the pandemic in 1892.
The Spanish Flu saw the silver price accelerate during this time period, from $0.90 at the end of 1917, to a high of $1.36/oz by March 1919 when the pandemic finally subsided.
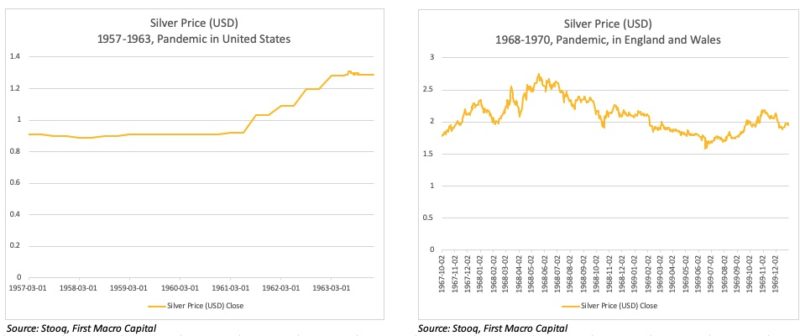
During the multi-year pandemic from 1957-1963, we saw silver prices rise from $0.91/oz to $1.31/oz in July 1963. The silver price did not rise until there was a pause in the pandemic between the second and final, third wave.
In the 1968-1970 pandemic, we saw the silver price fall initially from $2.34/oz to a low of $1.98/oz as the first wave took hold, before accelerating to a high of $2.75/oz during the summer months of 1968 before the second and final wave took hold in the winter of 1968 and in 1969. This final wave took the silver price down throughout the second wave. Silver bottomed at $1.69/oz in June of 1969. Mixed results throughout the pandemic in 1968-1970.

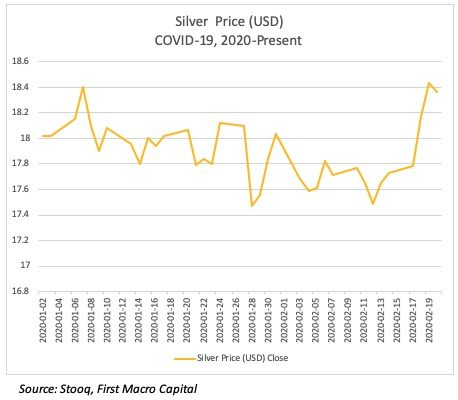
During this first phase of the COVID-19, we have seen silver head higher, but it is still early days.

Gold was pegged during all four of the pandemics outlined, and we view gold as being treated more like a currency today, particularly as we enter 2020-Q2, where we see slowing GDP growth and slowing inflation, pushing real rates down. Real rates falling is positive for gold.
- Silver is not guaranteed to protect one’s wealth during a pandemic, as history has highlighted mixed results. It may provide trading opportunities.
- A weakening home currency in countries that are negatively impacted by the pandemic could see silver prices rise in their home currency.
- Slowing industrial demand will push demand for silver down, though if mines have to shut because towns that support mines could be impacted by the virus, then this will create shortages for silver. Still too early days to see what will happen. Slowing industrial demand seems more likely with PMIs continue to crash even before they took into account the impact of the virus. Shortages are a more wait and see.
- Gold may be a better place to protect one’s wealth during a pandemic.
- US Dollar? Possibly – The US Dollar rose as the tech cycle ended in 2000, which looks increasingly likely the tech cycle is ending in 2020 with Apple’s recent warning on shipments and temporarily shutting down stores.
- Bitcoin? Possible
Get the exact checklist that Professionals use to find winning Gold mining producer stocks.
Apply this to any mining producer stock in under 30 minutes!