There has been an incredible amount of chatter as to how many times the Federal Reserve is going to raise rates in 2018, and the speed at which it will raise them by. For gold investors, the old question lingers, “What will rising interest rates mean for the price of gold?” The simple viewpoint has been that rising rates are bad for gold because gold is not an interest-bearing asset. Why would you own gold if interest rates are rising and gold doesn’t pay you anything? There are typically two sides to the debate on the impact of gold from the change in interest rates. There are those who see rising interest rates as good for gold, and there are those that see rising interest rates as harmful to the price of gold. But who is right? We look to see which side is correct? Could they both be wrong? Or both are right?
WHAT HAPPENED BEFORE GOLD WINDOW CLOSED FROM THE NIXON SHOCK?
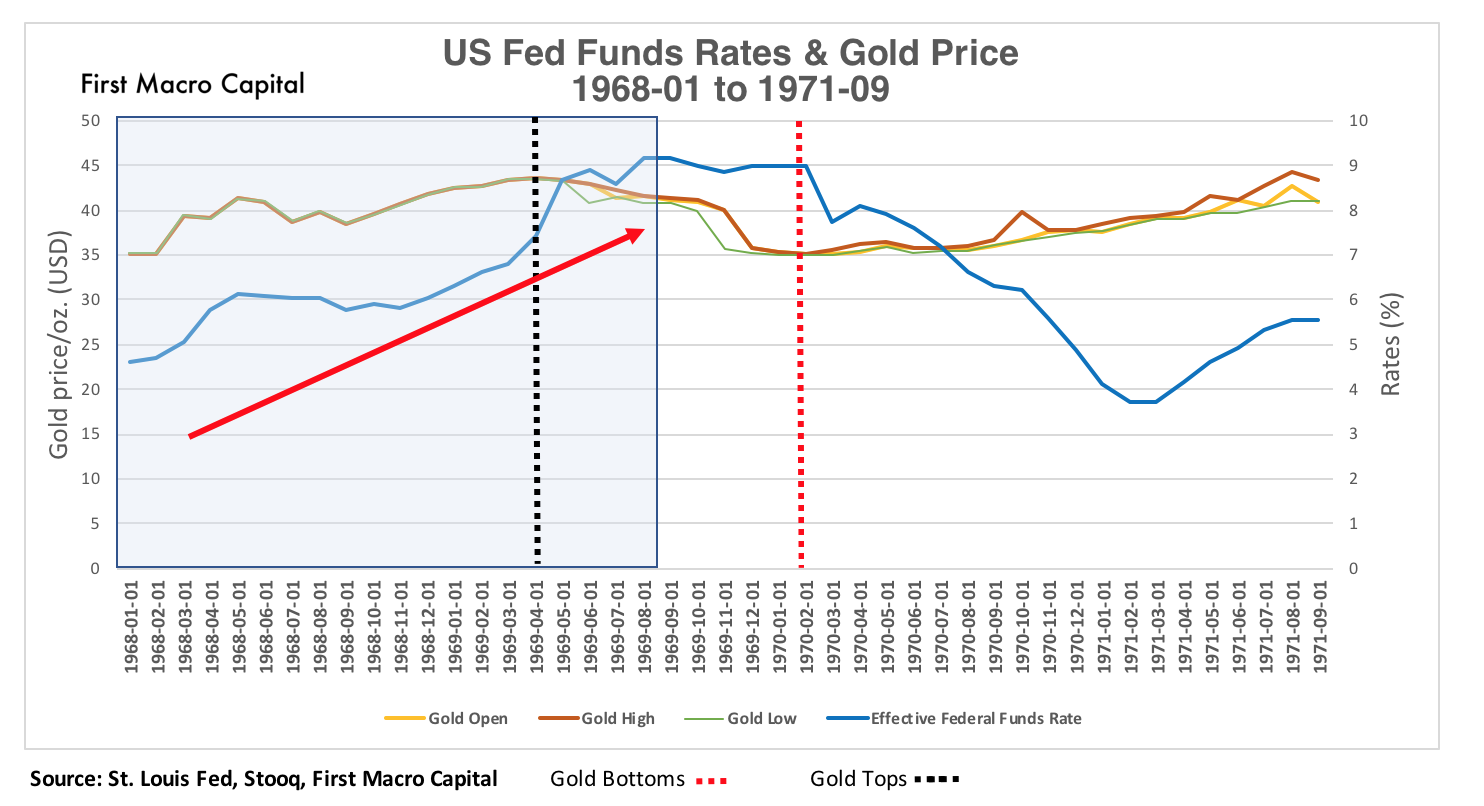
During the three-year period from 1968 to 1971, we witnessed the fed funds rate double from 4.6% to a high of 9.19% in 1969, before falling back down to 3.71% in March 1971. During this time, the gold price went from $35.20/oz. to a high of $43.60/oz. in 1969, three months before the fed funds rate peaked. Gold appreciated 23.2%, nothing spectacular, before falling back to $35.1/oz. in March 1970, a year before the fed funds rate bottomed. We can say that during this time period the trend for both gold and interest rates rose together. The trend was less consistent on the way down and with the recovery thereafter.
WHAT HAPPENED TO GOLD & INTEREST RATES DURING THE 1970’s?
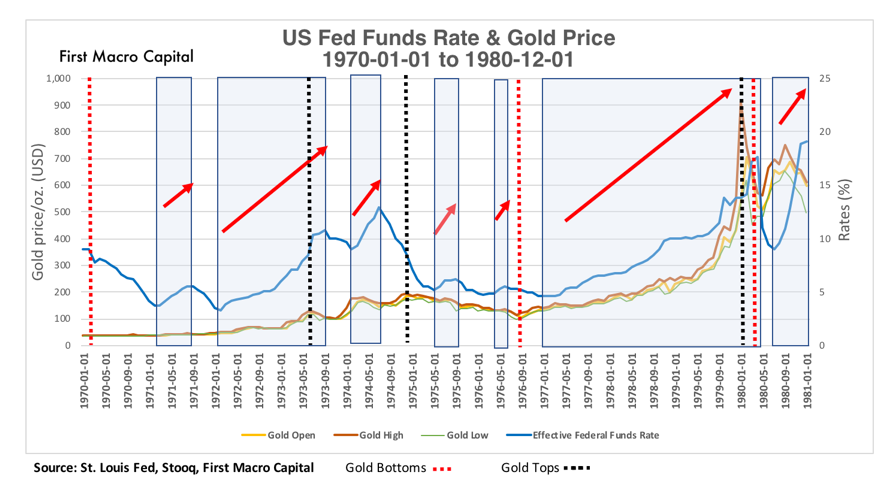
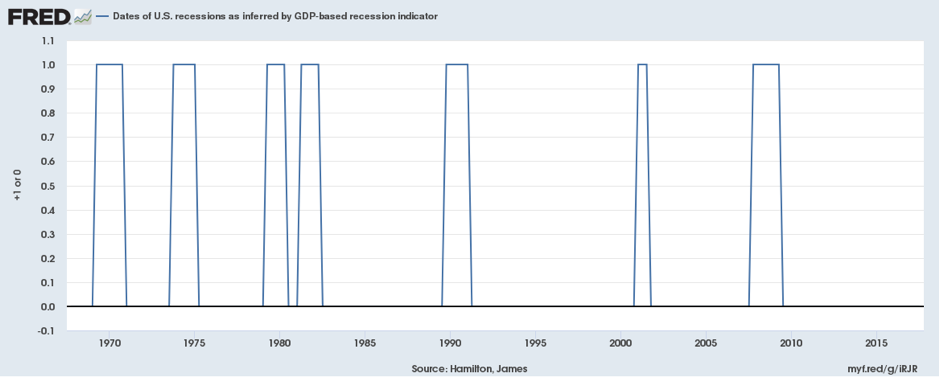
We had seven periods during the 1970’s where the US Fed Fund rates rose for consecutive months before falling for multiple months. The 1970’s started while in a recession, had a recession halfway through and ended with a recession. There were two oil crises in 1973 and 1979, and it was a period of higher inflation. It was a volatile time.
GOLD AFTER THE NIXON SHOCK
Gold bottomed about a year prior the fed funds rate did in February 1970 at $35.20/oz. After Nixon closed the gold window in August 1970, gold went to $195.5/oz. in December 1974. The fed funds rate peaked five months earlier in July 1974 at 12.92%. Many investors use the period after the Nixon closed the gold window (August 1970), as more of a true market gold price. This is because free-market forces were now allowed to decide what the US dollar and gold were worth against one another. Over the next twenty months, gold went down from the December 1974 high, to hit a low of $100/oz. in August 1976.
INTEREST RATES AFTER THE NIXON SHOCK
After peaking out in August 1971, the fed funds rates bottomed at 3.29%, then moved up to 12.72% in July 1974. Just like when rates were rising on the way up, there were pauses on the way down, briefly going up before bottoming out. After the peak in 1974, rates finally bottomed in January 1977 at 4.61%. There were pauses on the way up for both gold and interest rates. As the old saying goes, “Nothing goes straight Up”. In the first half of the 1970’s, neither one led one another all of the time. They at times switched which one led when peaking and when bottoming. They also did not conclusively show that if one was rising, the other would always be falling.
THE SECOND HALF OF THE 1970’s
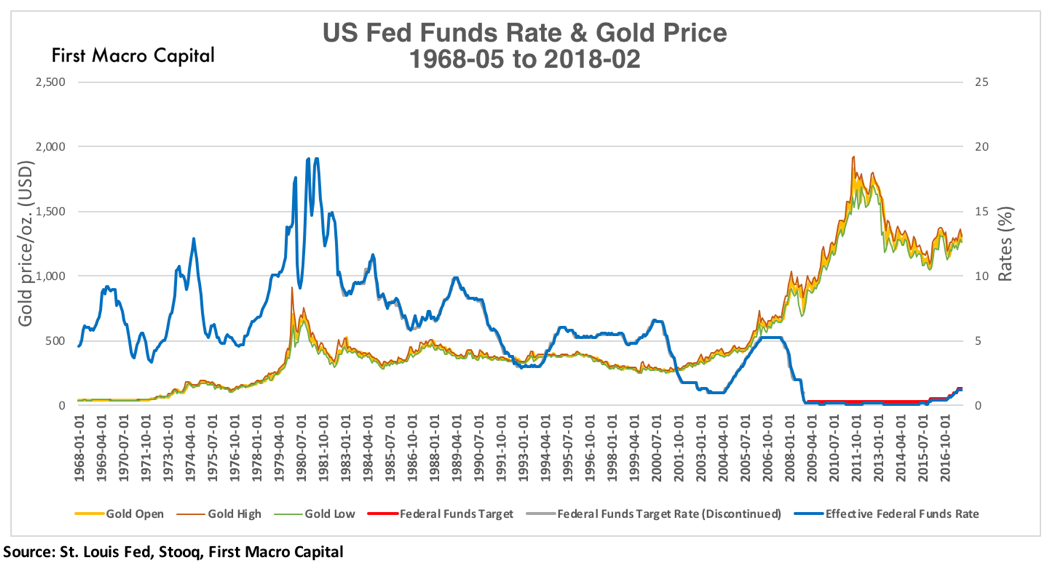
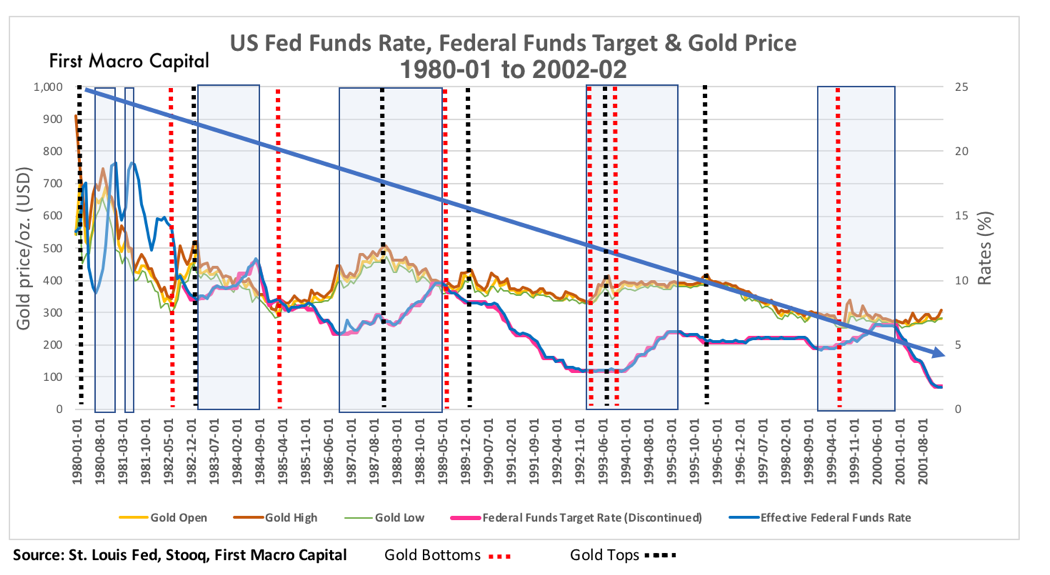
The second period of the 1970’s, investors saw a meteoric rise in interest rates from a low of 4.61% in January 1977, to 19.1% in June 1981. Gold went from $100/oz. in December 1976 to $910.60/oz. in January 1980, increasing by more than 50% increase in the final phase transition up. Gold started its rises a few months prior to interest rates moving up and peaked out a few months before. In this instance, from a multi-year trend perspective, gold and interest moved in the same direction with one another. Interest rates made an initial bottom to 8.63% in May 1983. Whereas gold, bottomed out almost 14 months prior, at $312.50/oz. On a multi-year trend basis, gold and the fed funds rate approximately moved together. During the 1970’s, the relationship between gold and interest rates can be better viewed on a decade basis to get a clearer picture because you can see their behavior throughout the business cycles.
HOW DID GOLD & THE FED FUNDS RATES DO IN THE 80’S & 90’s?
After former Fed Chairman, Paul Volcker stepped in and tamed inflation with the ratcheting up of interest rates, the U.S. experienced a deep recession thereafter. Gold plummeted to $312.51/Oz in March 1982, as rates came back down bottoming out in March 1983. If one was to look at the entire 20-year trend, the fed funds rate would be down, and gold would be the same. It would appear that the relationship can be best viewed over long-term time periods just like in the 1970’s. Shorter-term time periods during the 1980’s and 1990’s did not provide conclusive results between the fed funds rates and gold.
WHAT HAPPENED TO GOLD AND THE FED FUNDS RATE IN THE 2000’s?
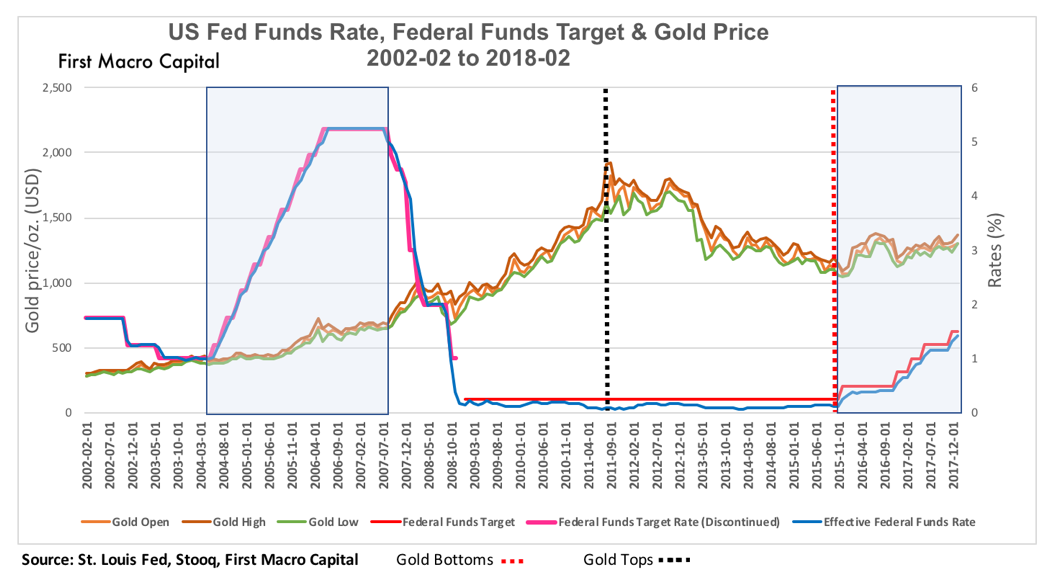
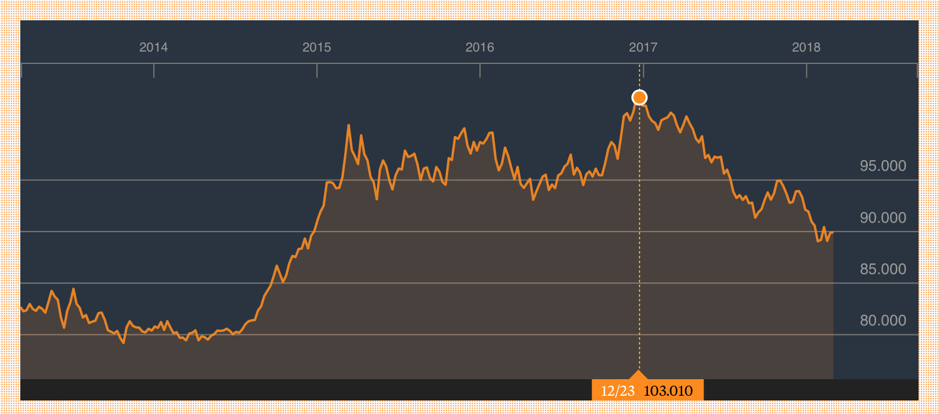
After the tech boom in the United States, the Federal Reserve dropped its target to 1% in June 2003, with the fed funds rate hitting a low of 0.98%. Gold bottomed in June 1999 at $251.95/oz., almost four years before interest rates bottomed. All commodities boomed as demand from the emerging markets grew rapidly led by China. The US dollar index went from being above 120 in 2001, falling to just above 70 in 2008. A 42% drop! When you combine the increasing commodity demand from China and the fall in the US dollar. These set the gold price on a higher trajectory, just like the entire commodity complex during this time. Gold did not break its bullish trend, until seven months after the Fed started lowering rates. By this time the Fed’s target was already cut in half to 2.25%. But the gold trend broke away from the low rates, after making a brief bottom in October 2008 at $621.45/oz., continuing its upward trend. After the banks were bailed out, investors began to see the issues were not just on the private asset side, but on the public side too.
WHAT HAPPENED IN THE 2010’s?
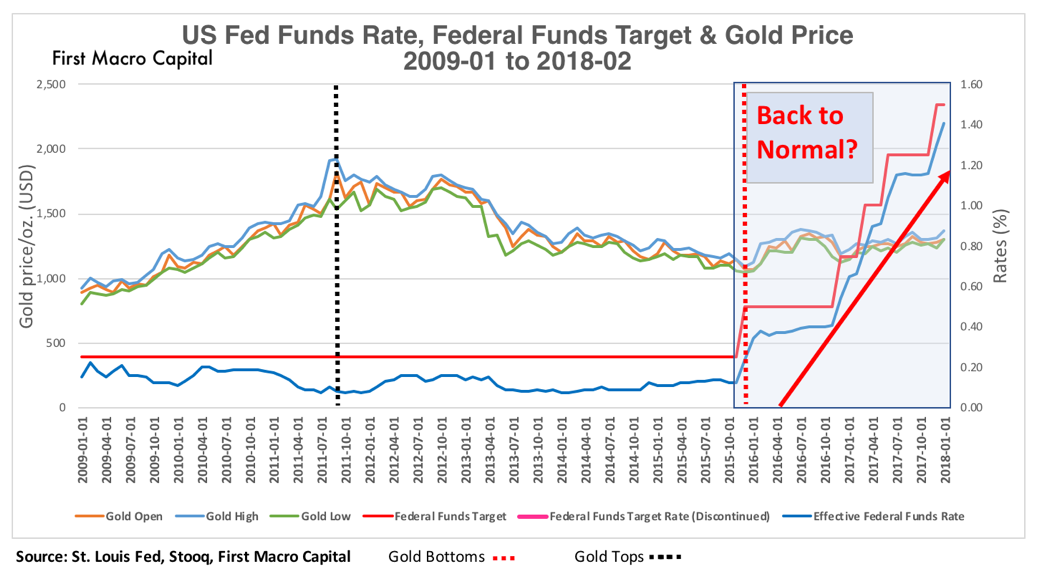
After 2008, the fed funds target rate stayed flat for six years at 0.25%. But the fed funds rate remained below the target the entire time. Unlike in the 2000’s where the moment the Fed dropped its target to 1%, the fed funds rate was already at or back above the target. On a monthly basis, the fed funds rate only fell below the 1% fed target once, to 0.98% over the 12-month period the target was at 1% in the early 2000’s.
THE BIG DISCONNECT
After 2008, gold and rates did not follow in lock-step with one another. We saw a major issue with the confidence in the U.S. Federal Government, and the European debt crisis. It was the confidence in the public sector, that drove assets out of public assets and into private assets, like gold and other commodities, not from rising rates.
THE COMMODITY COMPLEX
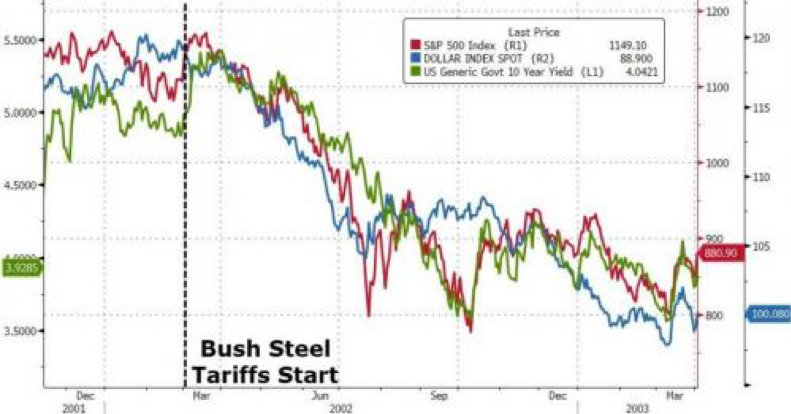
The commodity complex appears to have bottomed for many commodities, not just for gold, but for oil, uranium, and many of the base metals. The Fed has spoken about further rate hikes, and with the recent tariff talk, and the US dollar index topped out in December 2017, which will increase the volatility in the markets. In March 2002, the U.S. imposed 30% global steel imports. Interest rates went lower until 2004, and gold went higher. This rising gold may highlight an issue of confidence in the public assets and not of a relation to the interest rates in this instance. Commodities appear to be rising from the ashes, with a currently strong global economy reflected in the PMI’s, a declining US dollar since the end of 2017, increasing tariff risk, and it sets things up for higher commodity prices, over the next few years.
The USD Dollar Index
MORE RATE HIKES COMING – GOOD FOR GOLD?
On a monthly or yearly basis, it is difficult to conclude that the fed funds rate leads to gold, or gold leads the fed funds rate. What maybe be more helpful is to look at gold and interest rates over 5-10 years, even a 20-year period. The business cycle, which can range between 5-10 years, goes hand and hand with the rise and fall of the fed funds rate to complete its cycle. Commodity booms typically at least 4 years, and the bust is at least 2-3 years. We would consider setting the minimum time period to compare both gold and interest rates at least over a 7-8-year period, to compare their behavior to one another. Over the next 5-10 years, it is more likely that we will see higher commodity prices as the bond bubble bursts, the debts are reignited from rising rates, which will push capital flowing into private assets like commodities, not just gold. In the near-term over 1-2 years, history is not conclusive enough to give any solid evidence as to the relationship between the fed funds rate and gold.
TAKE AWAY FOR THE PORTFOLIO MANAGER & GOLD STOCK ANALYST
- The commentators were both right.
- Predicting the outcome of interest rates and gold in relation to one another on a monthly basis can be a difficult task. Over the past 40 years, the data shows that gold can lead interest rates, or interest rates can lead gold. They can even go in the opposite direction for extended periods.
- Stick to areas of the value chain within the gold sector that you have an advantage over others.
- Companies growing the production profile on a year-over-year basis above industry peers have an opportunity to create shareholder value.
- Follow the commodity complex. Commodity cycles, which considers all commodities together, are more predictable over long-term time periods to gold than interest rates.
Paul Farrugia, BCom. Paul is the President & CEO of First Macro Capital. He helps his readers identify mining stocks that you can hold for the long-term. He provides a checklist to find winning gold and silver mining producer stocks, including battery metals.
Get the exact checklist that Professionals use to find winning Gold mining producer stocks.
Apply this to any mining producer stock in under 30 minutes!
